Page MenuHomePureOS Tracker

octave plots not working properly in amber
Incomplete, NormalPublic

Description

Plots look wrong or they are not shown at all in octave. Problem is related to graphics toolkits 'qt' (the default one) and 'fltk'. It happens when using octave from PureOS amber repositories (version 4.4.1) but also with the latest octave version (through flatpak) and the development version obtained from Octave repository. It does not happen in Debian 10 (tested in a virtual machine).

Example to reproduce:

$ octave
[...]
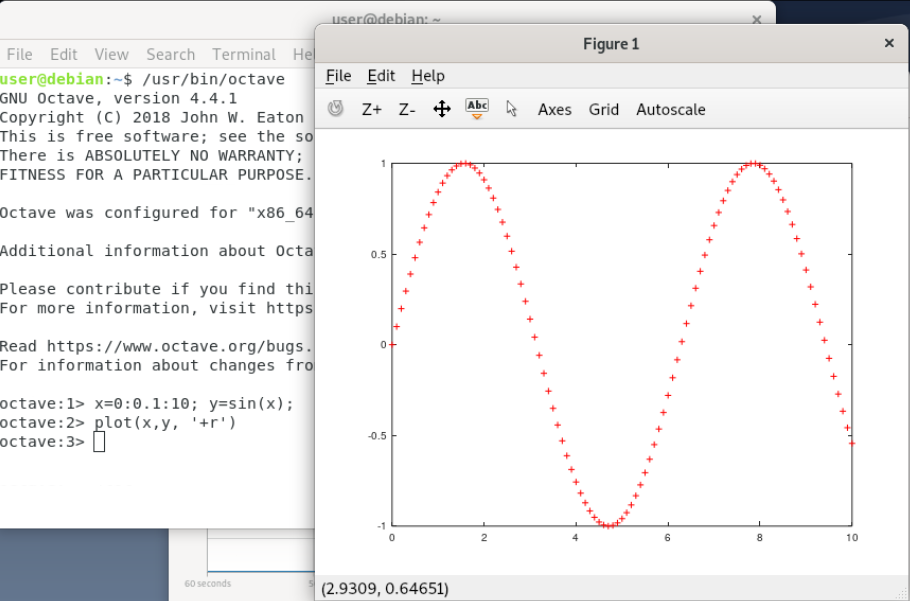
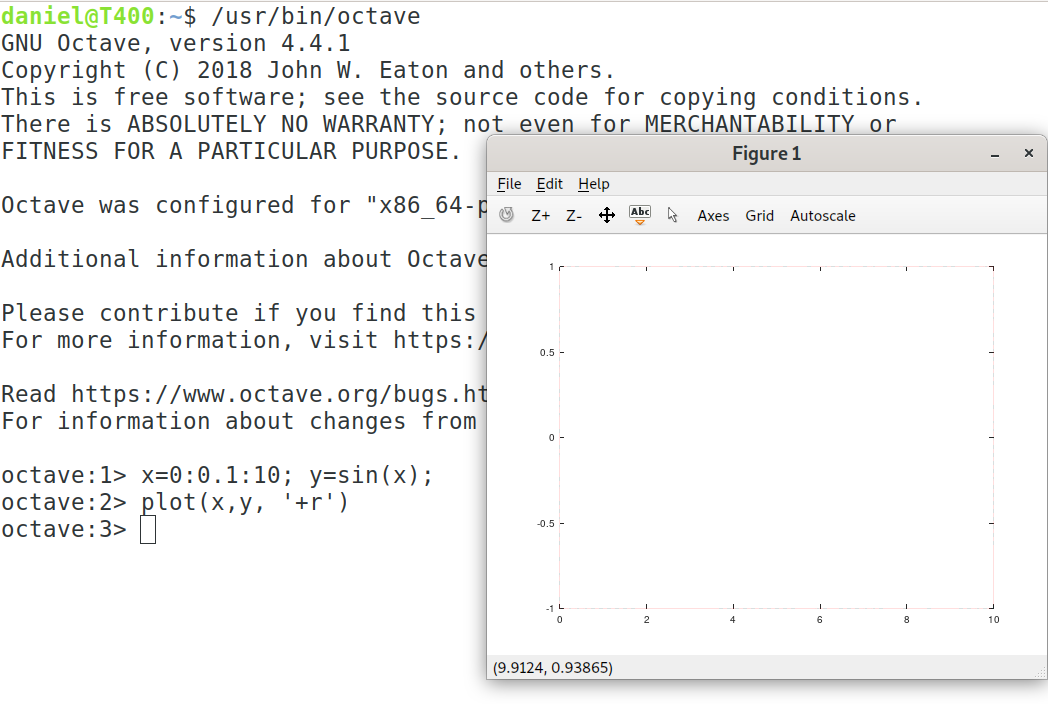
octave:1> x=0:0.1:10; y=sin(x);
octave:2> plot(x,y, '+r')

I include a screenshot of an example of correct behavior in Debian 10 and what is shown in PureOS amber.

As a workaround, 'gnuplot' toolkit can be used

graphics_toolkit("gnuplot")

and plots seem to be displayed (more) correctly.

I am available to help if it is needed.

Event Timeline

I forgot to say that the version of debian 10 I tested was using XFCE. I will try with Gnome so maybe the error is related to that,

I confirm that it is working properly in debian-live with Gnome 3.

daniel-molina updated the task description. (Show Details)May 23 2020, 08:33

I tried octave in Byzantium and the bug is not present (at least the proposed example above works).

jonas.smedegaard changed the task status from Open to Incomplete.May 25 2021, 10:56
jonas.smedegaard triaged this task as Normal priority.
jonas.smedegaard added a subscriber: jonas.smedegaard.

PureOS is mostly Debian, with only few changes. I suspect that PureOS does not change from Debian for the parts involved in this issue, and it therefore is an issue upstream in Debian.

Could you please try if the bug exist in Debian 9?